Open Source & Self-Hosted uptime monitoring for small teams to catch outages before users do

Engineer-grade uptime monitoring that you own and control. No cloud dependencies, no vendor lock-in.
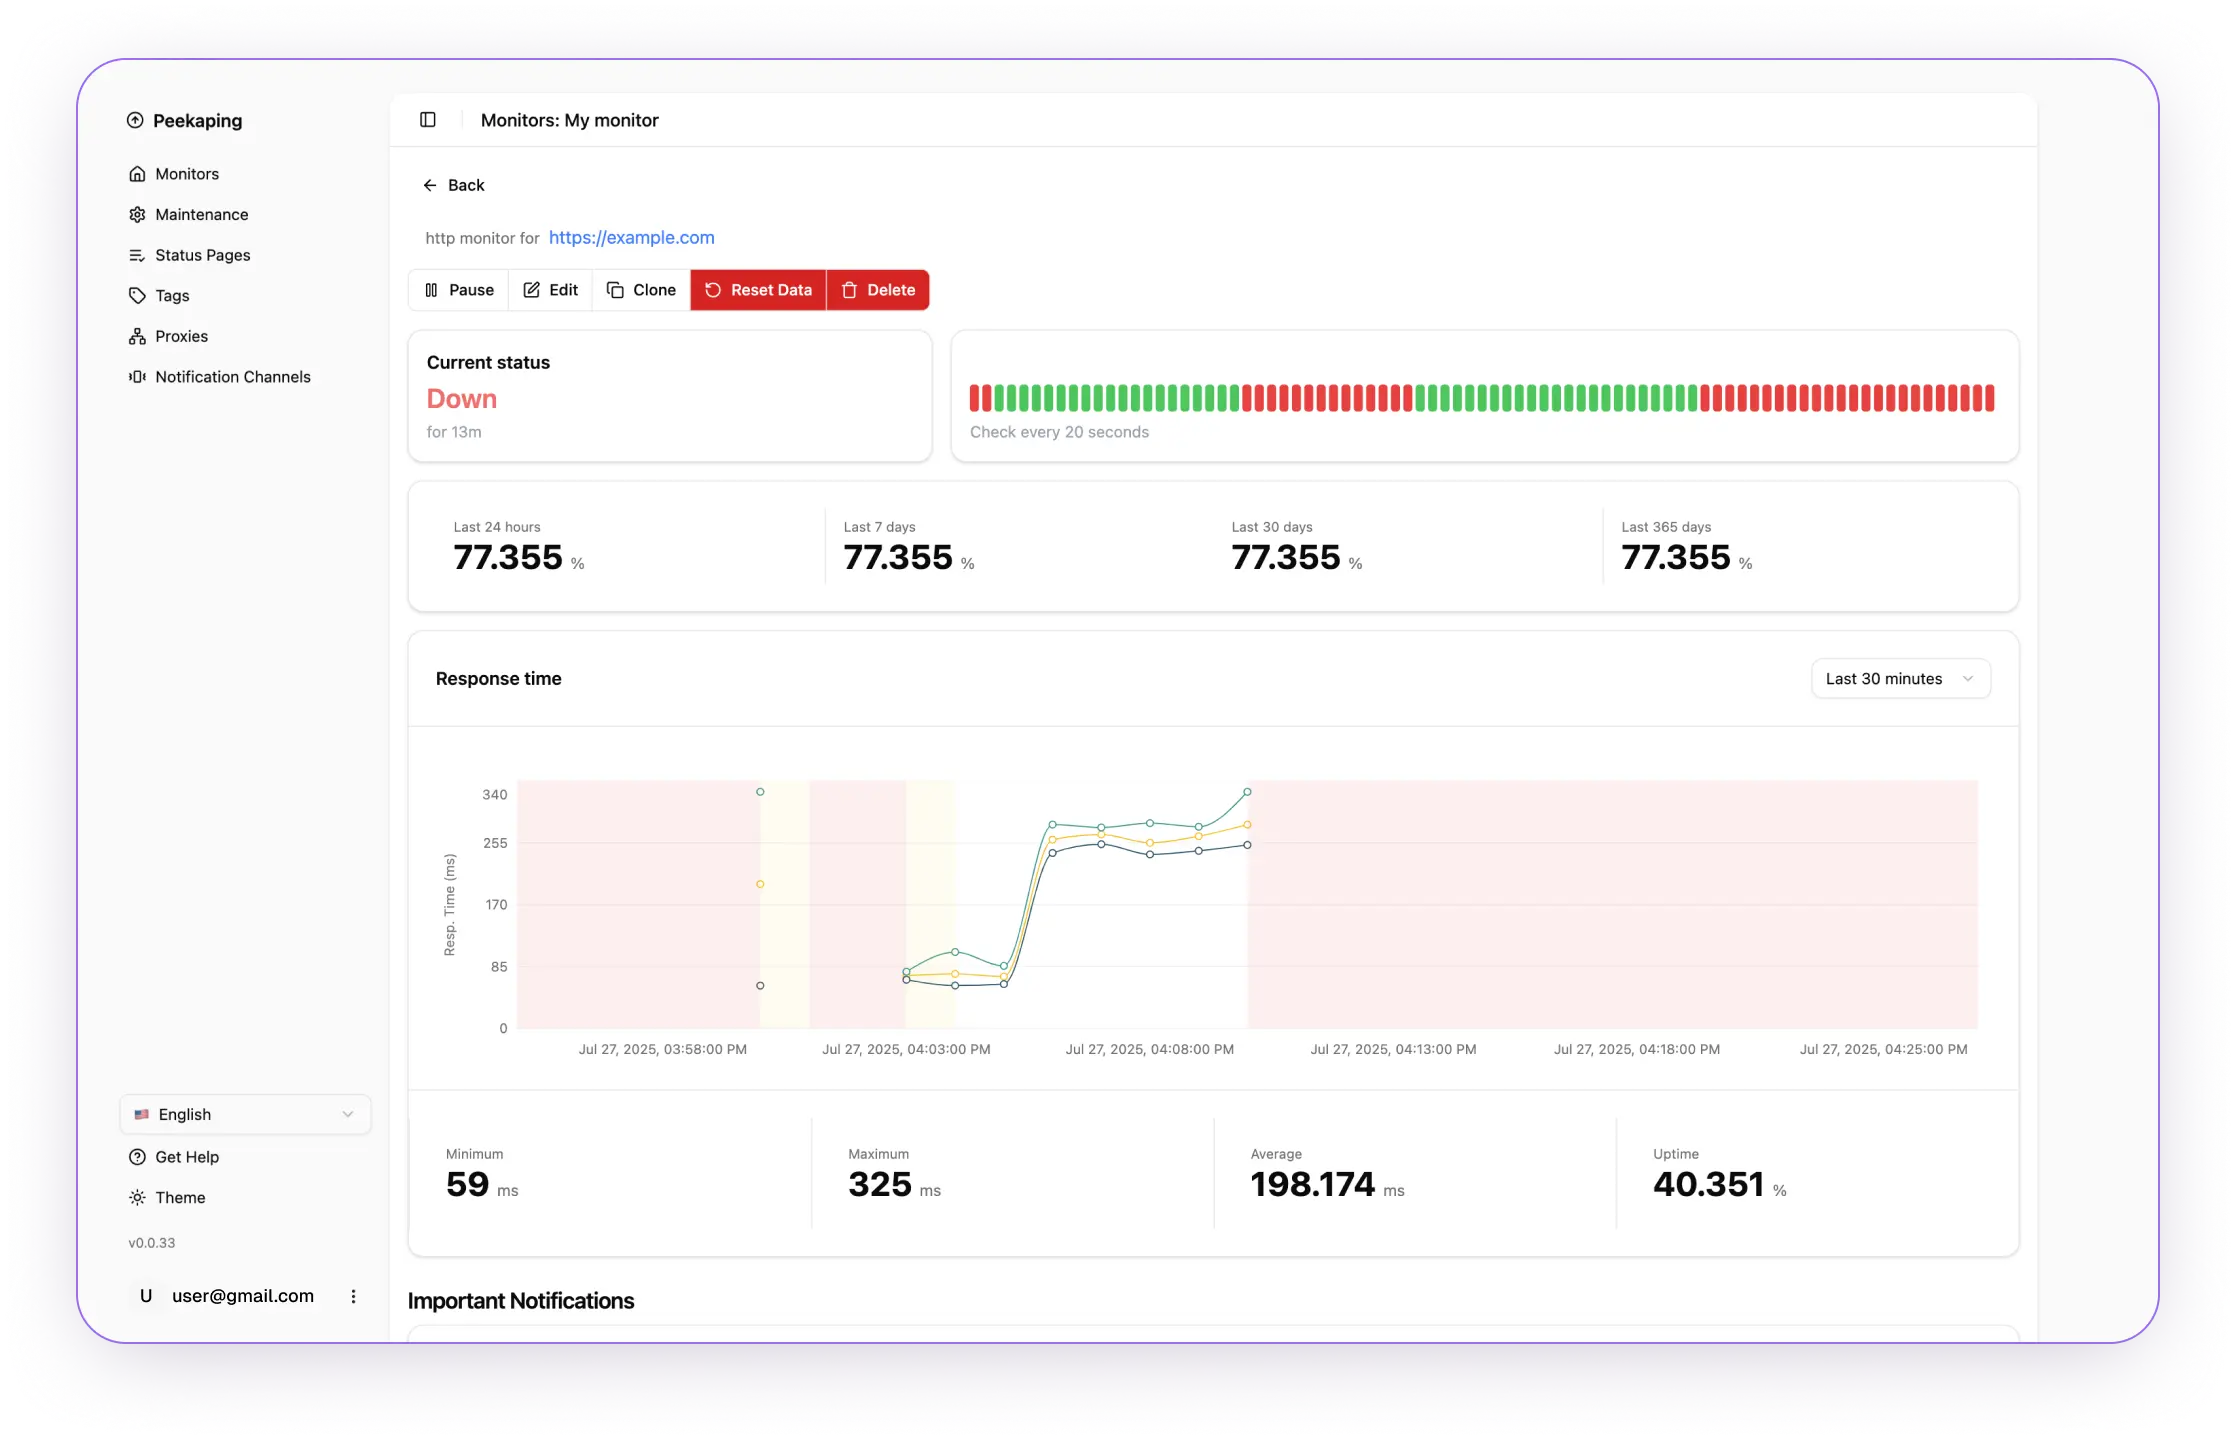
πŸ”“ 100% Open Source β€’ 🏠 Self-Hosted Only (for now)
Peekaping

Available Monitors

Web & Network
HTTP/HTTPS β€” Monitor websites, APIs, and web services
TCP β€” Check TCP port connectivity and availability
Ping (ICMP) β€” Measure reachability and round-trip latency
DNS β€” Verify query responses and resolution times
Application & Infrastructure
Push (incoming webhook) β€” Accept heartbeats from jobs and services
Docker container β€” Track container status and health
gRPC β€” Run gRPC health/service checks and latency
SNMP β€” Poll device availability and key OIDs
Databases & Caches
PostgreSQL β€” Connect and run a lightweight query
Microsoft SQL Server β€” Connect and run a lightweight query
MongoDB β€” Ping/handshake and simple read
Redis β€” PING/latency and basic health
Messaging & Streaming
MQTT Broker β€” Connect/subscribe/publish smoke test
RabbitMQ β€” Connection and queue health
Kafka Producer β€” Produce a test message to a topic

Alert Channels

Email & Webhooks
Email (SMTP) β€” Send alerts via your SMTP server
Webhook β€” POST JSON payloads to any HTTP endpoint
Chat & Collaboration
Telegram β€” Bot messages to users/channels
Slack β€” Incoming webhook to channels
Google Chat β€” Space webhooks
Signal β€” Secure messages via bot/integration
Mattermost β€” Incoming webhook to channels
Matrix β€” Send to rooms via access token
Discord β€” Channel webhooks
WeCom β€” Enterprise messages to groups
WhatsApp (WAHA) β€” Via WAHA gateway
On-Call & Incident
PagerDuty β€” Trigger incidents and escalations
Opsgenie β€” Alerts, routing, and on-call
Grafana OnCall β€” Integrate with on-call schedules
Mobile Push & Self-Hosted
NTFY β€” Simple pub/sub push notifications
Gotify β€” Self-hosted push server
Pushover β€” Reliable mobile/desktop push

Tech Stack

Go (Golang) β€” High-performance, lightweight concurrency
React + TypeScript β€” Type-safe admin dashboard and status pages
Docker β€” Easy to deploy and run
Data Storage (Selectable)
PostgreSQL β€” Relational database for structured data
MongoDB β€” Flexible document store
SQLite β€” Single-file DB for lightweight/self-hosted setups
Testimonials
What Community Says
We welcome contributions!
β€œI've been watching your releases and you have been hard at work. I just updated and its pinging great. Thank you! My first time following a project this early and I'm excited to see what the future has in store.”
β€œThis could be a great alternative. I've definitely experienced performance issues with UK [the alternative service]. Thanks for building this!”
β€œLooks nice and modern.”
β€œThis could be a great alternative. I've definitely experienced performance issues with UK [the alternative service]. Thanks for building this!”
β€œI've been watching your releases and you have been hard at work. I just updated and its pinging great. Thank you! My first time following a project this early and I'm excited to see what the future has in store.”
FAQ
Still Got Questions?
Toggle answer What is Peekaping?
Peekaping is an open-source, self-hosted uptime monitoring and status page tool built with Go and React. It monitors websites, APIs, and internal services and sends real-time notifications when issues occur.
Toggle answer How does Peekaping compare to Uptime Kuma?
Peekaping offers a similar experience with a focus on strongly typed code (Go + TypeScript), an API-first design with Swagger, and a modular architecture that makes it easy to extend and swap storage backends.
Toggle answer Does Peekaping have public status pages?
Yes. You can publish branded public status pages that show uptime, and performance metrics.
Toggle answer How do I deploy Peekaping?
Use official Docker images and docker-compose for quick setup, or run the Go API and React web app on a VM or bare metal.
Toggle answer Which databases are supported?
Peekaping supports MongoDB with options for PostgreSQL and SQLite via its pluggable storage design.
Toggle answer Is there a REST API?
Yes. Peekaping is API-first and includes Swagger/OpenAPI documentation for automation and integrations.
Toggle answer Can I migrate from Uptime Kuma?
A migration tool is being developed. For now, you can migrate manually.
Toggle answer Is Peekaping free for commercial use?
Yes. It’s MIT-licensed and free for personal and commercial projects.

Self hosted uptime monitor for service availability control

A self hosted uptime monitor is the foundation of a stable and predictable infrastructure. When websites, APIs, or internal services become unavailable, it is important to know about it immediately, not from users. Our service allows you to track the availability and operability of infrastructure in real time, fully within your environment and under your control.

The platform is deployed on your server or in your cloud and does not depend on external services. All monitoring data is stored with you, without being transferred to third parties. This approach is especially important for projects with increased requirements for security, privacy, and infrastructure management.

Our self hosted uptime monitor is suitable both for small teams and for growing projects with distributed architecture. The system scales easily, does not tie you to third-party providers, and provides a transparent understanding of the state of services at any moment in time.

Capabilities of the self hosted uptime monitor

The platform supports a wide range of checks required for modern availability monitoring. You can track HTTP and HTTPS websites, API endpoints, TCP ports, ICMP ping, DNS queries, Webhook checks in push mode, databases, and message brokers. Monitoring of Docker containers, gRPC services, and SNMP services is also supported, which allows you to control both the external perimeter and internal components of the infrastructure.

When problems occur, the service instantly sends notifications through convenient channels: Telegram, Slack, Email, WhatsApp, Discord, Webhook, and others. Notifications can be flexibly configured, separated by severity levels, and adapted to team processes so that responses are fast and without unnecessary noise.

For availability transparency, status pages are provided. They can be public for customers or private for internal use and display the current state of services in a clear and visual format. This helps reduce the number of support requests and increase trust in the service.

The platform is fully self-hosted: you choose the database β€” SQLite for an easy start or PostgreSQL and MongoDB for production workloads. You control data storage, access, and security. Two-factor authentication, protection against brute-force attacks, and monitoring of SSL certificate expiration dates are supported.

Our service is focused on teams that need a reliable self hosted uptime monitor without vendor lock-in, with flexible configuration, a modern interface, and the ability to fully control infrastructure. It helps detect failures in a timely manner, maintain service stability, and ensure transparency of their operation.

© 2025 Peekaping. All rights reserved.
Privacy Policy Terms and Conditions
Made with πŸ’œ by the Peekaping team